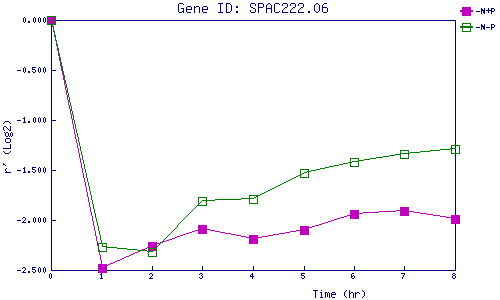
| 0 | 1 | 2 | 3 | 4 | 5 | 6 | 7 | 8 | |
| -N+P | 0.000 | -2.480 | -2.263 | -2.091 | -2.193 | -2.097 | -1.945 | -1.906 | -1.994 |
| -N-P | 0.000 | -2.272 | -2.324 | -1.810 | -1.788 | -1.526 | -1.416 | -1.341 | -1.287 |
|
-N+P: Nitrogen starved in the presence of P-factor -N-P: Nitrogen starved in the absence of P-factor |