hri2
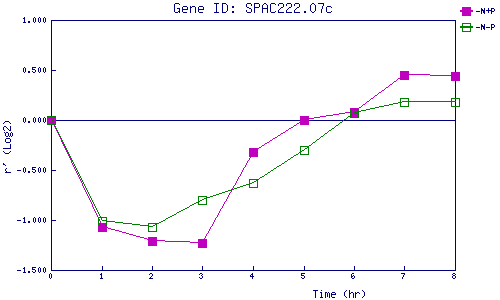
| 0 | 1 | 2 | 3 | 4 | 5 | 6 | 7 | 8 | |
| -N+P | 0.000 | -1.073 | -1.208 | -1.227 | -0.319 | 0.000 | 0.084 | 0.450 | 0.437 |
| -N-P | 0.000 | -1.007 | -1.072 | -0.797 | -0.630 | -0.297 | 0.070 | 0.181 | 0.180 |
|
-N+P: Nitrogen starved in the presence of P-factor -N-P: Nitrogen starved in the absence of P-factor |