byr4
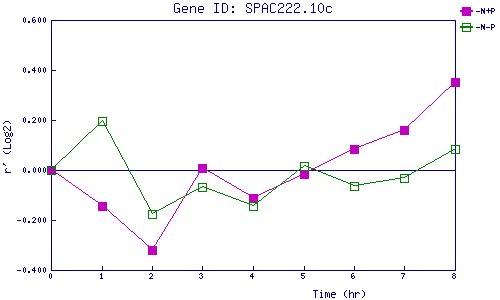
| 0 | 1 | 2 | 3 | 4 | 5 | 6 | 7 | 8 | |
| -N+P | 0.000 | -0.145 | -0.318 | 0.006 | -0.110 | -0.015 | 0.083 | 0.159 | 0.352 |
| -N-P | 0.000 | 0.195 | -0.175 | -0.069 | -0.145 | 0.014 | -0.062 | -0.031 | 0.084 |
|
-N+P: Nitrogen starved in the presence of P-factor -N-P: Nitrogen starved in the absence of P-factor |