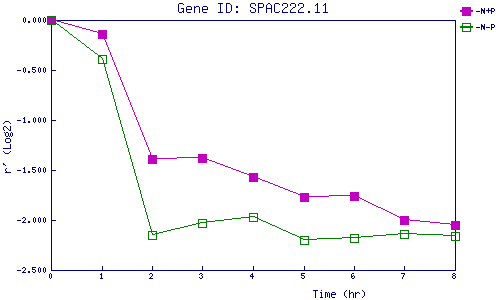
| 0 | 1 | 2 | 3 | 4 | 5 | 6 | 7 | 8 | |
| -N+P | 0.000 | -0.142 | -1.392 | -1.377 | -1.570 | -1.768 | -1.764 | -2.000 | -2.054 |
| -N-P | 0.000 | -0.388 | -2.149 | -2.034 | -1.973 | -2.202 | -2.179 | -2.142 | -2.164 |
|
-N+P: Nitrogen starved in the presence of P-factor -N-P: Nitrogen starved in the absence of P-factor |