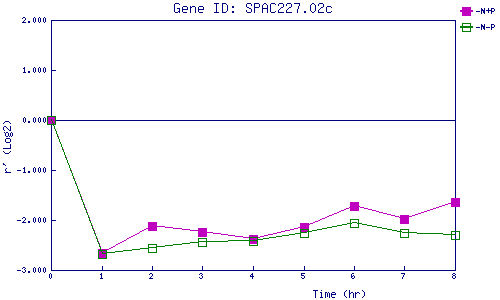
| 0 | 1 | 2 | 3 | 4 | 5 | 6 | 7 | 8 | |
| -N+P | 0.000 | -2.652 | -2.125 | -2.238 | -2.375 | -2.131 | -1.710 | -1.989 | -1.650 |
| -N-P | 0.000 | -2.688 | -2.563 | -2.432 | -2.429 | -2.252 | -2.053 | -2.268 | -2.309 |
|
-N+P: Nitrogen starved in the presence of P-factor -N-P: Nitrogen starved in the absence of P-factor |