| 0 | 1 | 2 | 3 | 4 | 5 | 6 | 7 | 8 | |
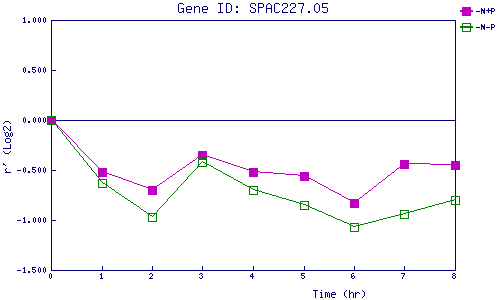
| -N+P | 0.000 | -0.521 | -0.700 | -0.346 | -0.524 | -0.555 | -0.830 | -0.442 | -0.452 |
| -N-P | 0.000 | -0.627 | -0.972 | -0.421 | -0.704 | -0.851 | -1.069 | -0.942 | -0.802 |
|
-N+P: Nitrogen starved in the presence of P-factor -N-P: Nitrogen starved in the absence of P-factor |