pab1
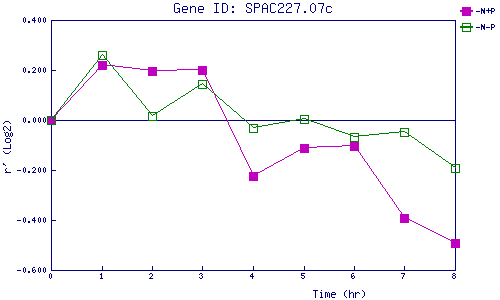
| 0 | 1 | 2 | 3 | 4 | 5 | 6 | 7 | 8 | |
| -N+P | 0.000 | 0.219 | 0.196 | 0.202 | -0.222 | -0.114 | -0.106 | -0.391 | -0.493 |
| -N-P | 0.000 | 0.260 | 0.017 | 0.143 | -0.033 | 0.004 | -0.068 | -0.050 | -0.192 |
|
-N+P: Nitrogen starved in the presence of P-factor -N-P: Nitrogen starved in the absence of P-factor |