| 0 | 1 | 2 | 3 | 4 | 5 | 6 | 7 | 8 | |
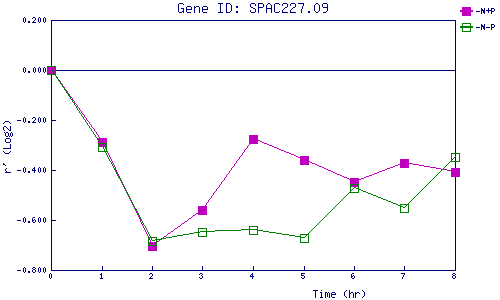
| -N+P | 0.000 | -0.289 | -0.706 | -0.561 | -0.276 | -0.360 | -0.450 | -0.373 | -0.408 |
| -N-P | 0.000 | -0.309 | -0.683 | -0.649 | -0.641 | -0.671 | -0.472 | -0.553 | -0.348 |
|
-N+P: Nitrogen starved in the presence of P-factor -N-P: Nitrogen starved in the absence of P-factor |