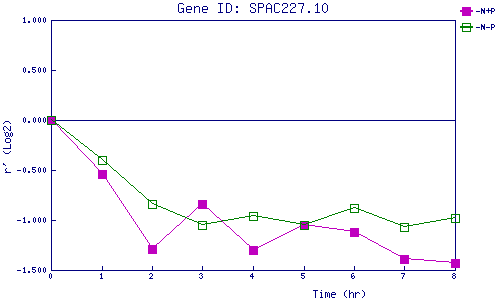
| 0 | 1 | 2 | 3 | 4 | 5 | 6 | 7 | 8 | |
| -N+P | 0.000 | -0.544 | -1.289 | -0.844 | -1.301 | -1.052 | -1.119 | -1.389 | -1.426 |
| -N-P | 0.000 | -0.405 | -0.835 | -1.046 | -0.957 | -1.051 | -0.884 | -1.074 | -0.978 |
|
-N+P: Nitrogen starved in the presence of P-factor -N-P: Nitrogen starved in the absence of P-factor |