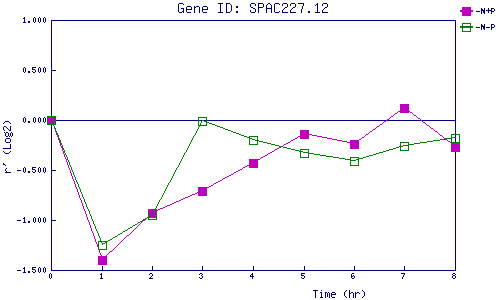
| 0 | 1 | 2 | 3 | 4 | 5 | 6 | 7 | 8 | |
| -N+P | 0.000 | -1.400 | -0.934 | -0.708 | -0.429 | -0.142 | -0.245 | 0.116 | -0.272 |
| -N-P | 0.000 | -1.254 | -0.949 | -0.012 | -0.202 | -0.327 | -0.410 | -0.265 | -0.178 |
|
-N+P: Nitrogen starved in the presence of P-factor -N-P: Nitrogen starved in the absence of P-factor |