Z8 snoRNA Z7 snoRNA Z5 snoRNA z4 snoRNA Z3 snoRNA
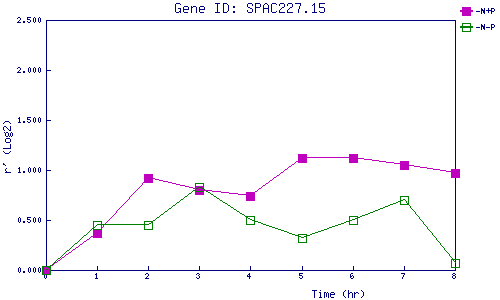
| 0 | 1 | 2 | 3 | 4 | 5 | 6 | 7 | 8 | |
| -N+P | 0.000 | 0.374 | 0.916 | 0.799 | 0.736 | 1.116 | 1.121 | 1.051 | 0.972 |
| -N-P | 0.000 | 0.447 | 0.451 | 0.832 | 0.499 | 0.316 | 0.505 | 0.704 | 0.068 |
|
-N+P: Nitrogen starved in the presence of P-factor -N-P: Nitrogen starved in the absence of P-factor |