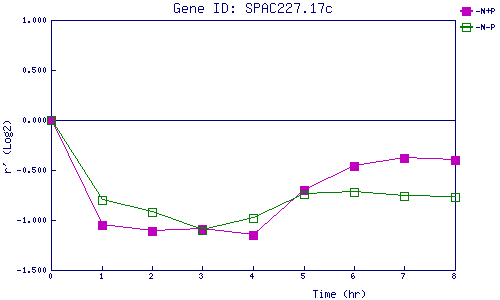
| 0 | 1 | 2 | 3 | 4 | 5 | 6 | 7 | 8 | |
| -N+P | 0.000 | -1.048 | -1.107 | -1.092 | -1.151 | -0.696 | -0.457 | -0.376 | -0.395 |
| -N-P | 0.000 | -0.805 | -0.925 | -1.104 | -0.985 | -0.740 | -0.720 | -0.763 | -0.774 |
|
-N+P: Nitrogen starved in the presence of P-factor -N-P: Nitrogen starved in the absence of P-factor |