lys3
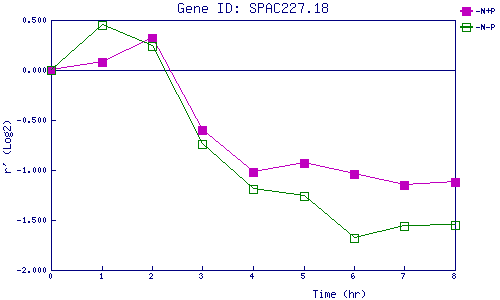
| 0 | 1 | 2 | 3 | 4 | 5 | 6 | 7 | 8 | |
| -N+P | 0.000 | 0.075 | 0.319 | -0.596 | -1.025 | -0.929 | -1.036 | -1.151 | -1.117 |
| -N-P | 0.000 | 0.451 | 0.242 | -0.737 | -1.191 | -1.259 | -1.676 | -1.558 | -1.551 |
|
-N+P: Nitrogen starved in the presence of P-factor -N-P: Nitrogen starved in the absence of P-factor |