| 0 | 1 | 2 | 3 | 4 | 5 | 6 | 7 | 8 | |
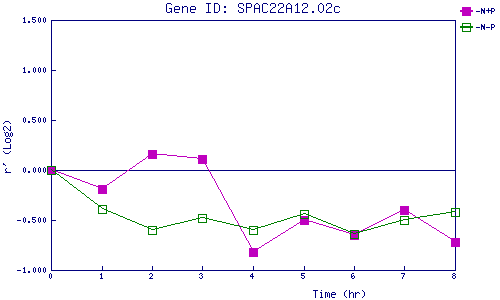
| -N+P | 0.000 | -0.192 | 0.160 | 0.114 | -0.819 | -0.502 | -0.651 | -0.401 | -0.723 |
| -N-P | 0.000 | -0.394 | -0.598 | -0.484 | -0.595 | -0.439 | -0.639 | -0.503 | -0.418 |
|
-N+P: Nitrogen starved in the presence of P-factor -N-P: Nitrogen starved in the absence of P-factor |