rpc11
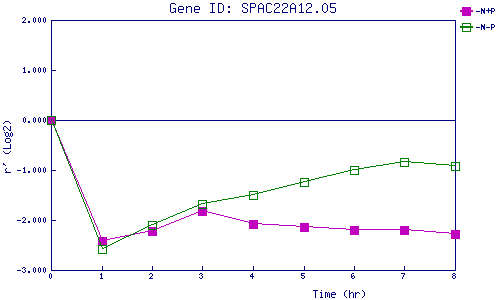
| 0 | 1 | 2 | 3 | 4 | 5 | 6 | 7 | 8 | |
| -N+P | 0.000 | -2.421 | -2.214 | -1.829 | -2.077 | -2.131 | -2.204 | -2.206 | -2.274 |
| -N-P | 0.000 | -2.578 | -2.097 | -1.677 | -1.502 | -1.245 | -0.993 | -0.837 | -0.918 |
|
-N+P: Nitrogen starved in the presence of P-factor -N-P: Nitrogen starved in the absence of P-factor |