| 0 | 1 | 2 | 3 | 4 | 5 | 6 | 7 | 8 | |
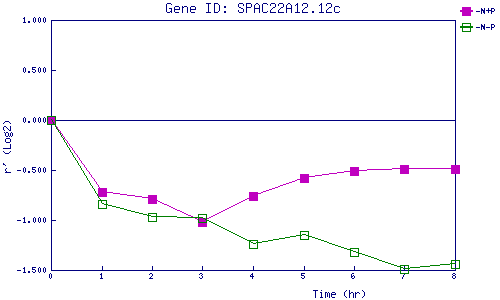
| -N+P | 0.000 | -0.718 | -0.788 | -1.021 | -0.765 | -0.584 | -0.506 | -0.492 | -0.493 |
| -N-P | 0.000 | -0.844 | -0.966 | -0.980 | -1.244 | -1.148 | -1.323 | -1.488 | -1.436 |
|
-N+P: Nitrogen starved in the presence of P-factor -N-P: Nitrogen starved in the absence of P-factor |