| 0 | 1 | 2 | 3 | 4 | 5 | 6 | 7 | 8 | |
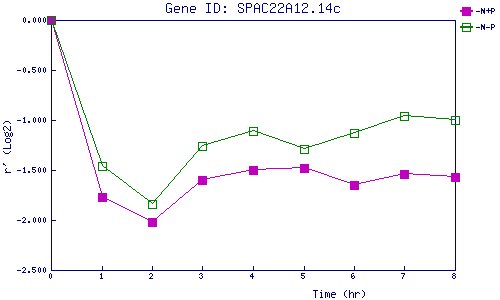
| -N+P | 0.000 | -1.771 | -2.021 | -1.599 | -1.496 | -1.475 | -1.654 | -1.540 | -1.570 |
| -N-P | 0.000 | -1.460 | -1.845 | -1.256 | -1.113 | -1.287 | -1.129 | -0.960 | -1.003 |
|
-N+P: Nitrogen starved in the presence of P-factor -N-P: Nitrogen starved in the absence of P-factor |