bip bip1
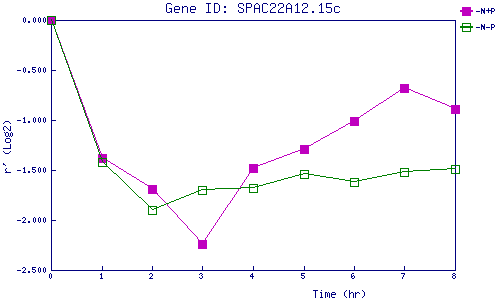
| 0 | 1 | 2 | 3 | 4 | 5 | 6 | 7 | 8 | |
| -N+P | 0.000 | -1.382 | -1.690 | -2.235 | -1.478 | -1.291 | -1.007 | -0.675 | -0.891 |
| -N-P | 0.000 | -1.416 | -1.903 | -1.697 | -1.678 | -1.545 | -1.625 | -1.521 | -1.489 |
|
-N+P: Nitrogen starved in the presence of P-factor -N-P: Nitrogen starved in the absence of P-factor |