| 0 | 1 | 2 | 3 | 4 | 5 | 6 | 7 | 8 | |
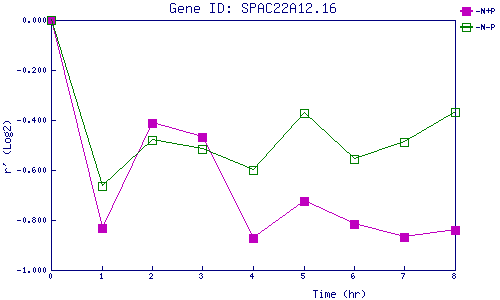
| -N+P | 0.000 | -0.832 | -0.412 | -0.469 | -0.874 | -0.724 | -0.817 | -0.869 | -0.839 |
| -N-P | 0.000 | -0.665 | -0.480 | -0.515 | -0.600 | -0.373 | -0.557 | -0.487 | -0.369 |
|
-N+P: Nitrogen starved in the presence of P-factor -N-P: Nitrogen starved in the absence of P-factor |