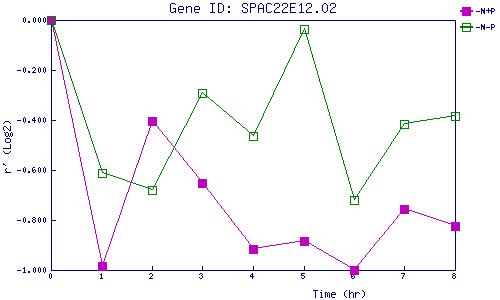
| 0 | 1 | 2 | 3 | 4 | 5 | 6 | 7 | 8 | |
| -N+P | 0.000 | -0.986 | -0.404 | -0.652 | -0.917 | -0.885 | -1.000 | -0.757 | -0.824 |
| -N-P | 0.000 | -0.611 | -0.681 | -0.292 | -0.463 | -0.035 | -0.720 | -0.417 | -0.386 |
|
-N+P: Nitrogen starved in the presence of P-factor -N-P: Nitrogen starved in the absence of P-factor |