| 0 | 1 | 2 | 3 | 4 | 5 | 6 | 7 | 8 | |
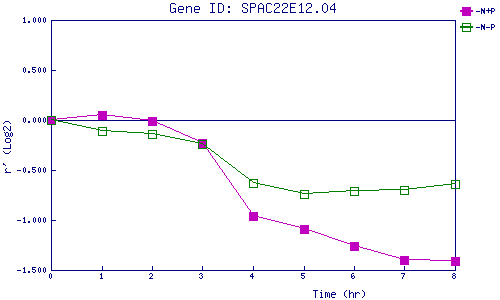
| -N+P | 0.000 | 0.051 | -0.009 | -0.227 | -0.962 | -1.094 | -1.257 | -1.399 | -1.413 |
| -N-P | 0.000 | -0.114 | -0.135 | -0.243 | -0.632 | -0.745 | -0.710 | -0.695 | -0.637 |
|
-N+P: Nitrogen starved in the presence of P-factor -N-P: Nitrogen starved in the absence of P-factor |