rer1
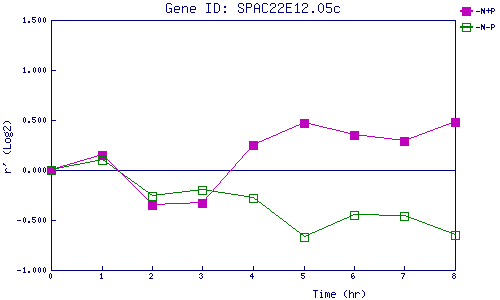
| 0 | 1 | 2 | 3 | 4 | 5 | 6 | 7 | 8 | |
| -N+P | 0.000 | 0.154 | -0.346 | -0.329 | 0.247 | 0.474 | 0.346 | 0.291 | 0.476 |
| -N-P | 0.000 | 0.102 | -0.256 | -0.204 | -0.276 | -0.673 | -0.451 | -0.463 | -0.653 |
|
-N+P: Nitrogen starved in the presence of P-factor -N-P: Nitrogen starved in the absence of P-factor |