rna1
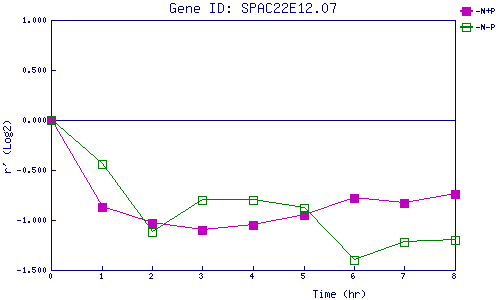
| 0 | 1 | 2 | 3 | 4 | 5 | 6 | 7 | 8 | |
| -N+P | 0.000 | -0.872 | -1.030 | -1.103 | -1.047 | -0.946 | -0.776 | -0.832 | -0.736 |
| -N-P | 0.000 | -0.441 | -1.125 | -0.802 | -0.804 | -0.881 | -1.403 | -1.225 | -1.196 |
|
-N+P: Nitrogen starved in the presence of P-factor -N-P: Nitrogen starved in the absence of P-factor |