rrn10
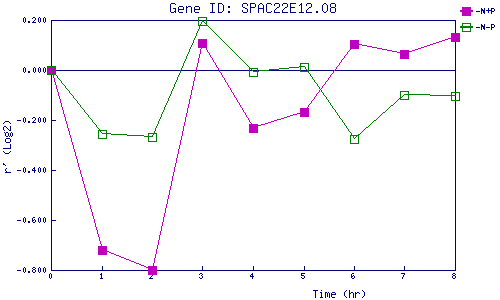
| 0 | 1 | 2 | 3 | 4 | 5 | 6 | 7 | 8 | |
| -N+P | 0.000 | -0.718 | -0.799 | 0.108 | -0.230 | -0.166 | 0.103 | 0.066 | 0.131 |
| -N-P | 0.000 | -0.254 | -0.267 | 0.197 | -0.010 | 0.011 | -0.277 | -0.100 | -0.106 |
|
-N+P: Nitrogen starved in the presence of P-factor -N-P: Nitrogen starved in the absence of P-factor |