krp1 krp
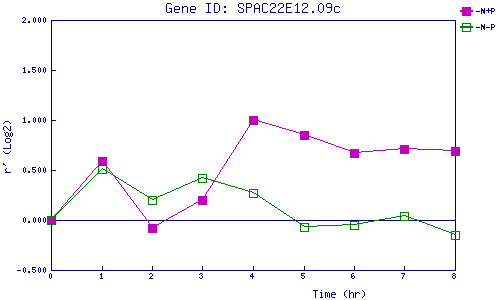
| 0 | 1 | 2 | 3 | 4 | 5 | 6 | 7 | 8 | |
| -N+P | 0.000 | 0.591 | -0.078 | 0.201 | 1.003 | 0.847 | 0.673 | 0.713 | 0.686 |
| -N-P | 0.000 | 0.507 | 0.203 | 0.415 | 0.266 | -0.074 | -0.046 | 0.039 | -0.153 |
|
-N+P: Nitrogen starved in the presence of P-factor -N-P: Nitrogen starved in the absence of P-factor |