etp1 cox15
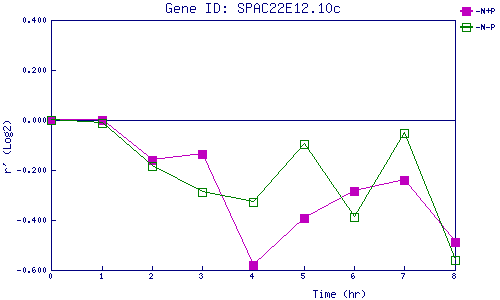
| 0 | 1 | 2 | 3 | 4 | 5 | 6 | 7 | 8 | |
| -N+P | 0.000 | 0.000 | -0.159 | -0.134 | -0.579 | -0.394 | -0.285 | -0.240 | -0.488 |
| -N-P | 0.000 | -0.011 | -0.185 | -0.288 | -0.326 | -0.098 | -0.387 | -0.053 | -0.559 |
|
-N+P: Nitrogen starved in the presence of P-factor -N-P: Nitrogen starved in the absence of P-factor |