rpl24-3 rpl2403
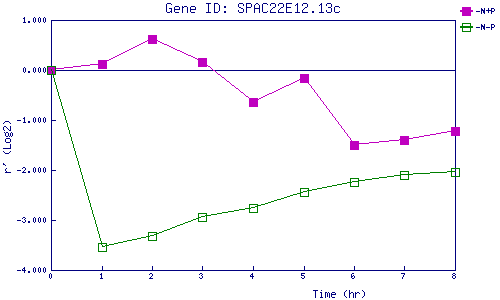
| 0 | 1 | 2 | 3 | 4 | 5 | 6 | 7 | 8 | |
| -N+P | 0.000 | 0.124 | 0.620 | 0.160 | -0.635 | -0.164 | -1.503 | -1.401 | -1.217 |
| -N-P | 0.000 | -3.542 | -3.310 | -2.935 | -2.770 | -2.438 | -2.250 | -2.091 | -2.049 |
|
-N+P: Nitrogen starved in the presence of P-factor -N-P: Nitrogen starved in the absence of P-factor |