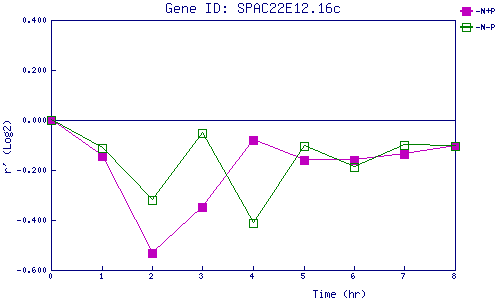
| 0 | 1 | 2 | 3 | 4 | 5 | 6 | 7 | 8 | |
| -N+P | 0.000 | -0.144 | -0.531 | -0.347 | -0.080 | -0.158 | -0.162 | -0.136 | -0.106 |
| -N-P | 0.000 | -0.111 | -0.321 | -0.053 | -0.413 | -0.102 | -0.188 | -0.100 | -0.104 |
|
-N+P: Nitrogen starved in the presence of P-factor -N-P: Nitrogen starved in the absence of P-factor |