| 0 | 1 | 2 | 3 | 4 | 5 | 6 | 7 | 8 | |
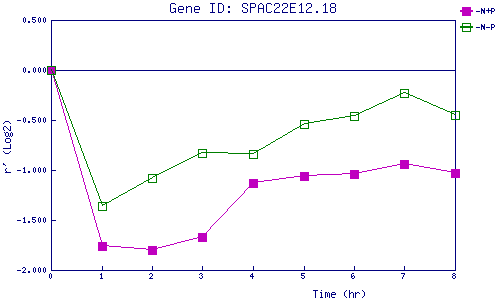
| -N+P | 0.000 | -1.764 | -1.799 | -1.670 | -1.133 | -1.060 | -1.043 | -0.943 | -1.027 |
| -N-P | 0.000 | -1.365 | -1.082 | -0.833 | -0.839 | -0.541 | -0.461 | -0.227 | -0.449 |
|
-N+P: Nitrogen starved in the presence of P-factor -N-P: Nitrogen starved in the absence of P-factor |