atf31
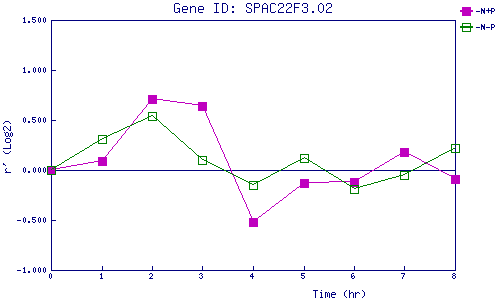
| 0 | 1 | 2 | 3 | 4 | 5 | 6 | 7 | 8 | |
| -N+P | 0.000 | 0.093 | 0.710 | 0.640 | -0.523 | -0.131 | -0.121 | 0.181 | -0.094 |
| -N-P | 0.000 | 0.311 | 0.538 | 0.096 | -0.153 | 0.120 | -0.190 | -0.054 | 0.222 |
|
-N+P: Nitrogen starved in the presence of P-factor -N-P: Nitrogen starved in the absence of P-factor |