rdh54
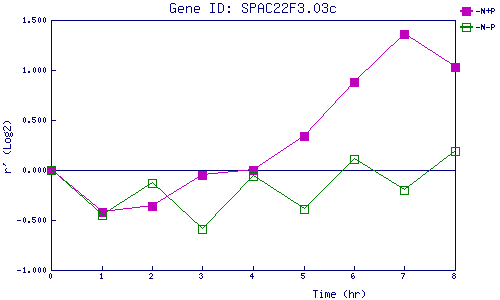
| 0 | 1 | 2 | 3 | 4 | 5 | 6 | 7 | 8 | |
| -N+P | 0.000 | -0.423 | -0.360 | -0.050 | -0.005 | 0.335 | 0.875 | 1.365 | 1.033 |
| -N-P | 0.000 | -0.452 | -0.128 | -0.592 | -0.060 | -0.388 | 0.112 | -0.203 | 0.194 |
|
-N+P: Nitrogen starved in the presence of P-factor -N-P: Nitrogen starved in the absence of P-factor |