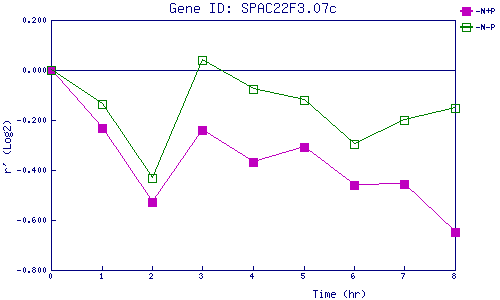
| 0 | 1 | 2 | 3 | 4 | 5 | 6 | 7 | 8 | |
| -N+P | 0.000 | -0.234 | -0.528 | -0.242 | -0.367 | -0.309 | -0.461 | -0.457 | -0.648 |
| -N-P | 0.000 | -0.138 | -0.430 | 0.038 | -0.076 | -0.119 | -0.297 | -0.201 | -0.153 |
|
-N+P: Nitrogen starved in the presence of P-factor -N-P: Nitrogen starved in the absence of P-factor |