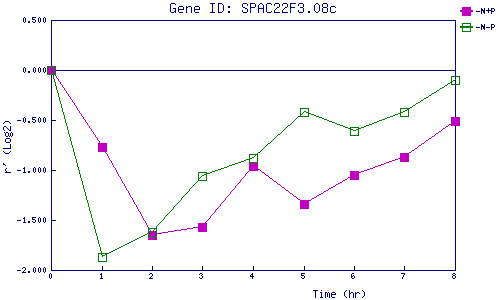
| 0 | 1 | 2 | 3 | 4 | 5 | 6 | 7 | 8 | |
| -N+P | 0.000 | -0.770 | -1.654 | -1.570 | -0.963 | -1.335 | -1.054 | -0.872 | -0.506 |
| -N-P | 0.000 | -1.872 | -1.624 | -1.057 | -0.882 | -0.417 | -0.609 | -0.418 | -0.099 |
|
-N+P: Nitrogen starved in the presence of P-factor -N-P: Nitrogen starved in the absence of P-factor |