res2 pct1 mcs1
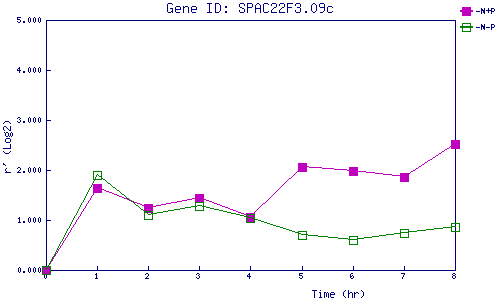
| 0 | 1 | 2 | 3 | 4 | 5 | 6 | 7 | 8 | |
| -N+P | 0.000 | 1.642 | 1.239 | 1.447 | 1.057 | 2.062 | 1.976 | 1.862 | 2.516 |
| -N-P | 0.000 | 1.895 | 1.102 | 1.280 | 1.050 | 0.698 | 0.609 | 0.737 | 0.859 |
|
-N+P: Nitrogen starved in the presence of P-factor -N-P: Nitrogen starved in the absence of P-factor |