gcs1
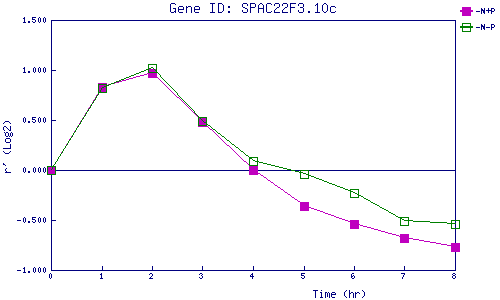
| 0 | 1 | 2 | 3 | 4 | 5 | 6 | 7 | 8 | |
| -N+P | 0.000 | 0.826 | 0.970 | 0.481 | -0.003 | -0.362 | -0.537 | -0.682 | -0.768 |
| -N-P | 0.000 | 0.822 | 1.016 | 0.486 | 0.092 | -0.045 | -0.226 | -0.513 | -0.537 |
|
-N+P: Nitrogen starved in the presence of P-factor -N-P: Nitrogen starved in the absence of P-factor |