| 0 | 1 | 2 | 3 | 4 | 5 | 6 | 7 | 8 | |
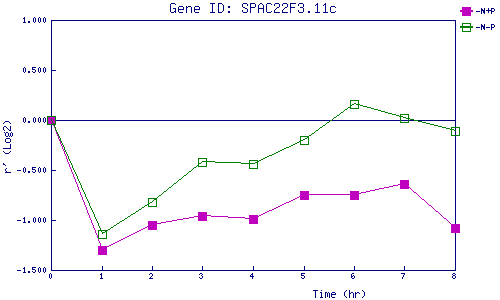
| -N+P | 0.000 | -1.297 | -1.051 | -0.961 | -0.990 | -0.751 | -0.747 | -0.635 | -1.080 |
| -N-P | 0.000 | -1.138 | -0.822 | -0.421 | -0.436 | -0.201 | 0.164 | 0.021 | -0.107 |
|
-N+P: Nitrogen starved in the presence of P-factor -N-P: Nitrogen starved in the absence of P-factor |