pam1
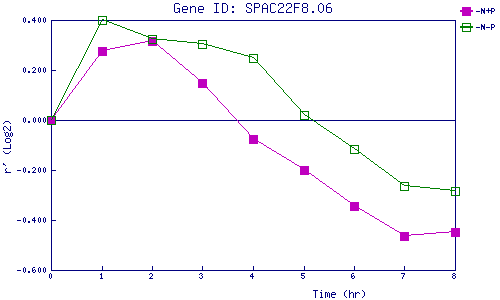
| 0 | 1 | 2 | 3 | 4 | 5 | 6 | 7 | 8 | |
| -N+P | 0.000 | 0.275 | 0.316 | 0.149 | -0.076 | -0.199 | -0.345 | -0.463 | -0.450 |
| -N-P | 0.000 | 0.399 | 0.324 | 0.306 | 0.250 | 0.020 | -0.116 | -0.265 | -0.285 |
|
-N+P: Nitrogen starved in the presence of P-factor -N-P: Nitrogen starved in the absence of P-factor |