| 0 | 1 | 2 | 3 | 4 | 5 | 6 | 7 | 8 | |
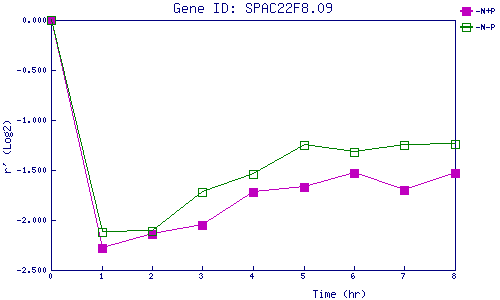
| -N+P | 0.000 | -2.278 | -2.137 | -2.051 | -1.716 | -1.673 | -1.532 | -1.698 | -1.529 |
| -N-P | 0.000 | -2.122 | -2.111 | -1.724 | -1.541 | -1.252 | -1.315 | -1.254 | -1.242 |
|
-N+P: Nitrogen starved in the presence of P-factor -N-P: Nitrogen starved in the absence of P-factor |