sap145
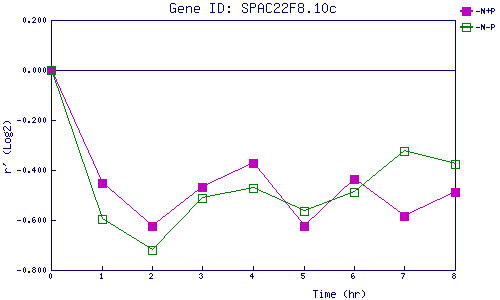
| 0 | 1 | 2 | 3 | 4 | 5 | 6 | 7 | 8 | |
| -N+P | 0.000 | -0.451 | -0.626 | -0.468 | -0.371 | -0.625 | -0.437 | -0.585 | -0.489 |
| -N-P | 0.000 | -0.595 | -0.722 | -0.510 | -0.472 | -0.563 | -0.488 | -0.325 | -0.375 |
|
-N+P: Nitrogen starved in the presence of P-factor -N-P: Nitrogen starved in the absence of P-factor |