plc1
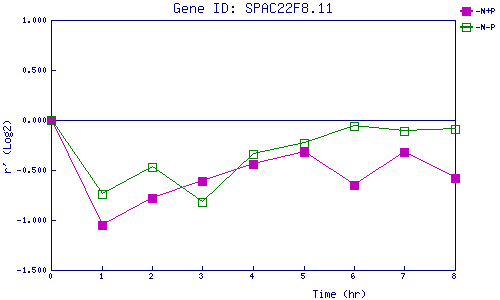
| 0 | 1 | 2 | 3 | 4 | 5 | 6 | 7 | 8 | |
| -N+P | 0.000 | -1.052 | -0.775 | -0.607 | -0.445 | -0.315 | -0.650 | -0.317 | -0.575 |
| -N-P | 0.000 | -0.741 | -0.469 | -0.818 | -0.337 | -0.231 | -0.057 | -0.106 | -0.087 |
|
-N+P: Nitrogen starved in the presence of P-factor -N-P: Nitrogen starved in the absence of P-factor |