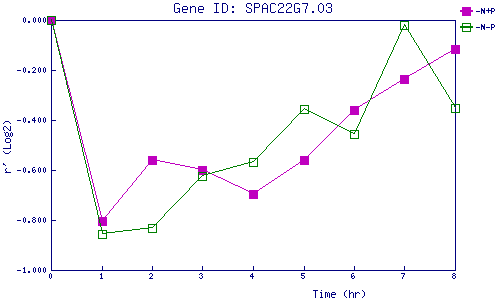
| 0 | 1 | 2 | 3 | 4 | 5 | 6 | 7 | 8 | |
| -N+P | 0.000 | -0.804 | -0.561 | -0.598 | -0.694 | -0.559 | -0.360 | -0.236 | -0.116 |
| -N-P | 0.000 | -0.857 | -0.834 | -0.624 | -0.568 | -0.356 | -0.454 | -0.019 | -0.351 |
|
-N+P: Nitrogen starved in the presence of P-factor -N-P: Nitrogen starved in the absence of P-factor |