reserved_name_ubp13
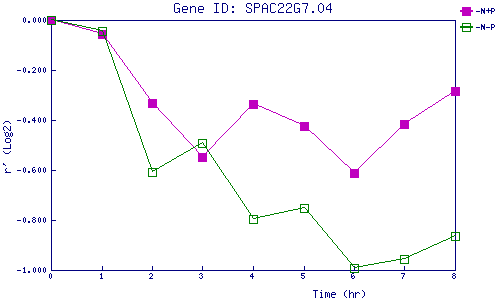
| 0 | 1 | 2 | 3 | 4 | 5 | 6 | 7 | 8 | |
| -N+P | 0.000 | -0.055 | -0.331 | -0.547 | -0.337 | -0.424 | -0.611 | -0.417 | -0.285 |
| -N-P | 0.000 | -0.045 | -0.610 | -0.491 | -0.796 | -0.751 | -0.992 | -0.955 | -0.866 |
|
-N+P: Nitrogen starved in the presence of P-factor -N-P: Nitrogen starved in the absence of P-factor |