| 0 | 1 | 2 | 3 | 4 | 5 | 6 | 7 | 8 | |
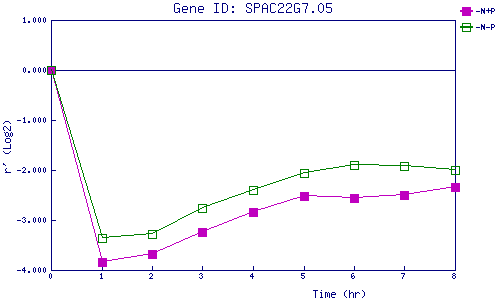
| -N+P | 0.000 | -3.844 | -3.681 | -3.232 | -2.841 | -2.529 | -2.560 | -2.502 | -2.336 |
| -N-P | 0.000 | -3.363 | -3.286 | -2.753 | -2.400 | -2.053 | -1.894 | -1.924 | -2.002 |
|
-N+P: Nitrogen starved in the presence of P-factor -N-P: Nitrogen starved in the absence of P-factor |