ura1
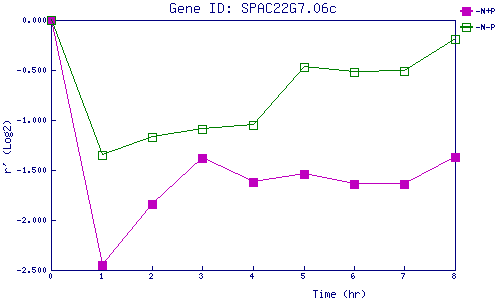
| 0 | 1 | 2 | 3 | 4 | 5 | 6 | 7 | 8 | |
| -N+P | 0.000 | -2.449 | -1.845 | -1.377 | -1.616 | -1.544 | -1.637 | -1.636 | -1.368 |
| -N-P | 0.000 | -1.350 | -1.172 | -1.089 | -1.047 | -0.466 | -0.521 | -0.509 | -0.187 |
|
-N+P: Nitrogen starved in the presence of P-factor -N-P: Nitrogen starved in the absence of P-factor |