scd2 ral3
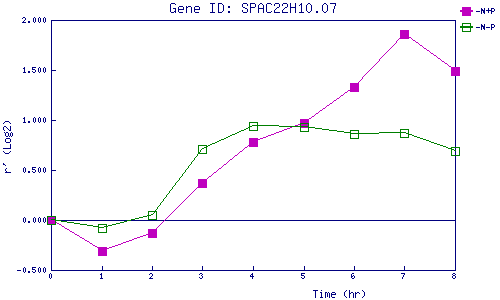
| 0 | 1 | 2 | 3 | 4 | 5 | 6 | 7 | 8 | |
| -N+P | 0.000 | -0.310 | -0.129 | 0.366 | 0.781 | 0.972 | 1.327 | 1.855 | 1.490 |
| -N-P | 0.000 | -0.078 | 0.047 | 0.713 | 0.938 | 0.927 | 0.863 | 0.869 | 0.690 |
|
-N+P: Nitrogen starved in the presence of P-factor -N-P: Nitrogen starved in the absence of P-factor |