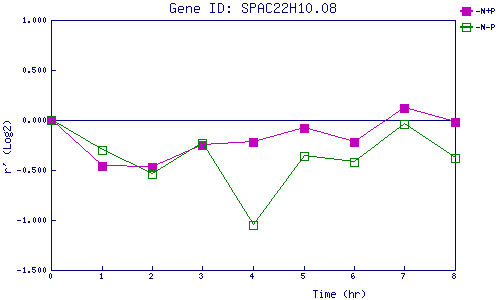
| 0 | 1 | 2 | 3 | 4 | 5 | 6 | 7 | 8 | |
| -N+P | 0.000 | -0.462 | -0.471 | -0.251 | -0.216 | -0.075 | -0.215 | 0.116 | -0.016 |
| -N-P | 0.000 | -0.303 | -0.536 | -0.226 | -1.048 | -0.363 | -0.419 | -0.038 | -0.376 |
|
-N+P: Nitrogen starved in the presence of P-factor -N-P: Nitrogen starved in the absence of P-factor |