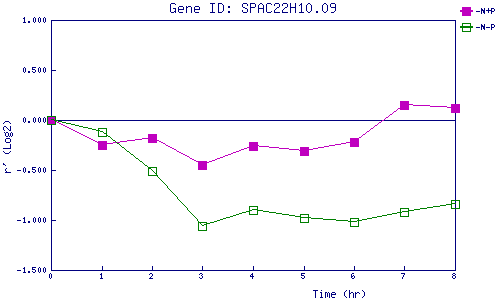
| 0 | 1 | 2 | 3 | 4 | 5 | 6 | 7 | 8 | |
| -N+P | 0.000 | -0.250 | -0.178 | -0.449 | -0.255 | -0.311 | -0.218 | 0.148 | 0.119 |
| -N-P | 0.000 | -0.119 | -0.507 | -1.055 | -0.904 | -0.985 | -1.023 | -0.918 | -0.835 |
|
-N+P: Nitrogen starved in the presence of P-factor -N-P: Nitrogen starved in the absence of P-factor |