sto1 alp21
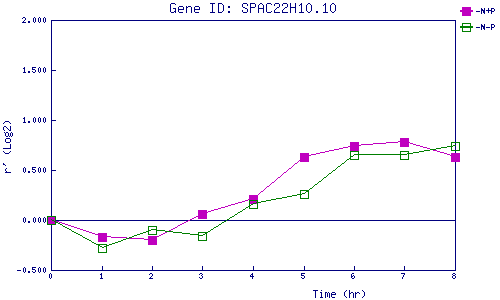
| 0 | 1 | 2 | 3 | 4 | 5 | 6 | 7 | 8 | |
| -N+P | 0.000 | -0.171 | -0.199 | 0.061 | 0.213 | 0.626 | 0.742 | 0.782 | 0.627 |
| -N-P | 0.000 | -0.284 | -0.102 | -0.163 | 0.155 | 0.258 | 0.652 | 0.654 | 0.738 |
|
-N+P: Nitrogen starved in the presence of P-factor -N-P: Nitrogen starved in the absence of P-factor |