| 0 | 1 | 2 | 3 | 4 | 5 | 6 | 7 | 8 | |
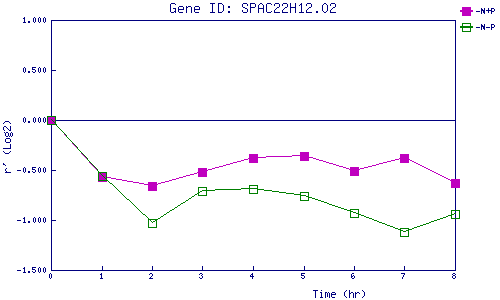
| -N+P | 0.000 | -0.570 | -0.661 | -0.516 | -0.379 | -0.360 | -0.511 | -0.385 | -0.626 |
| -N-P | 0.000 | -0.558 | -1.026 | -0.711 | -0.688 | -0.755 | -0.927 | -1.118 | -0.940 |
|
-N+P: Nitrogen starved in the presence of P-factor -N-P: Nitrogen starved in the absence of P-factor |