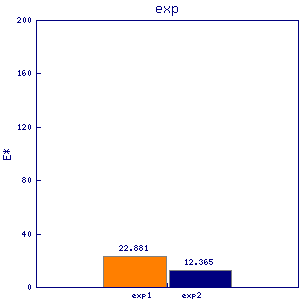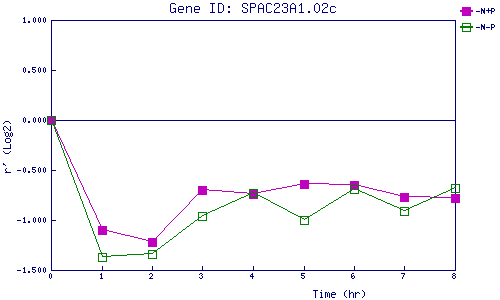
| 0 | 1 | 2 | 3 | 4 | 5 | 6 | 7 | 8 | |
| -N+P | 0.000 | -1.102 | -1.215 | -0.695 | -0.741 | -0.643 | -0.653 | -0.770 | -0.776 |
| -N-P | 0.000 | -1.374 | -1.338 | -0.956 | -0.729 | -0.997 | -0.693 | -0.907 | -0.684 |
|
-N+P: Nitrogen starved in the presence of P-factor -N-P: Nitrogen starved in the absence of P-factor |